Setup
varikondo comprises a suite of functions to convert output from purpuses superFreq (Flensburg et al. 2018), VarScan (Koboldt et al. 2012), VarDict (Lai et al. 2016), GATK3 Mutect2 (Cibulskis et al. 2013), and FreeBayes (Garrison and Marth 2012) into standardised data frames into R.
First, let’s load the package.
Import and parse a single VCF
The function parse_vcf_output() allows to convert a VCF file generated by one of four callers GATK3 MuTect2, VarDict, VarScan, and FreeBayes into a data frame with standardised fields. This is because different callers annotate the INFO field in the VCF ouput in different ways, using different names for read depth, variant allele frequency etc… The output from parse_vcf_output() can then be used as input for combine_and_filter() to combine variants and clinical information for different samples within the same patients and to fill in missing variants at specific time points. If the variants in the VCF file are also annotated with the Variant Effect Predictor (VEP) (McLaren et al. 2016), vep = TRUE will parse the extra fields.
Import only specific ranges of the VCF file
VEP might annotate the same variant multiple times, depending on whether a variants falls on several transcripts. VEP pastes together different annotations on the same line. parse_vcf_output() will reshape the input VCF and return it in a long format by stacking all the annotations one underneath each other. This has the potential to largely increase the size of the ouput file. To overcome this problem it is possible to read in R only restricted genomic regions at one time by specifying a GRanges() object in parse_vcf_output(param = VariantAnnotation::ScanVcfParam()). The param argument is directly passed to VariantAnnotation::readVcf() within parse_vcf_output().
The example VCF files below were annotated with VEP. Also chr20_varscan.vcf.gz, chr20_vardict.vcf.gz are available as example.
annot_vcf_mutect <- system.file("extdata", "chr20_mutect.vcf.gz", package = "varikondo")
annot_vcf_mutect
#> [1] "/Users/quaglieri.a/Library/R/3.5/library/varikondo/extdata/chr20_mutect.vcf.gz"
VCF files from VarDict, VarScan, and freebayes can be parsed by specifying caller = "vardict", caller = "varscan", caller = "freebayes".
parsed_vcf_mutect <- varikondo::parse_vcf_output(vcf_path = annot_vcf_mutect,
                                                 caller = "mutect",
                                                 sample_name = "Sample1",
vep = TRUE)| Location | caller | chrom | pos | end | ref | alt | qual | filter | genotype | tot_depth | VAF | ref_depth | alt_depth | ref_forw | ref_rev | alt_forw | alt_rev | start | width | ref_base_quality | alt_base_quality | SampleName | Allele | Consequence | IMPACT | SYMBOL | Gene | Feature_type | Feature | BIOTYPE | EXON | INTRON | HGVSc | HGVSp | cDNA_position | CDS_position | Protein_position | Amino_acids | Codons | Existing_variation | DISTANCE | STRAND | FLAGS | VARIANT_CLASS | SYMBOL_SOURCE | HGNC_ID | CANONICAL | TSL | APPRIS | CCDS | ENSP | SWISSPROT | TREMBL | UNIPARC | GENE_PHENO | SIFT | PolyPhen | DOMAINS | AF | AFR_AF | AMR_AF | EAS_AF | EUR_AF | SAS_AF | AA_AF | EA_AF | ExAC_AF | ExAC_Adj_AF | ExAC_AFR_AF | ExAC_AMR_AF | ExAC_EAS_AF | ExAC_FIN_AF | ExAC_NFE_AF | ExAC_OTH_AF | ExAC_SAS_AF | MAX_AF | MAX_AF_POPS | CLIN_SIG | SOMATIC | PHENO | PUBMED | MOTIF_NAME | MOTIF_POS | HIGH_INF_POS | MOTIF_SCORE_CHANGE | IMPACT_rank |
|---|---|---|---|---|---|---|---|---|---|---|---|---|---|---|---|---|---|---|---|---|---|---|---|---|---|---|---|---|---|---|---|---|---|---|---|---|---|---|---|---|---|---|---|---|---|---|---|---|---|---|---|---|---|---|---|---|---|---|---|---|---|---|---|---|---|---|---|---|---|---|---|---|---|---|---|---|---|---|---|---|---|---|---|---|---|---|
| chr20_30948281 | mutect | chr20 | 30948281 | 30948281 | A | G | 11.000 | PASS | 0/1 | 3 | 1 | 0 | 3 | 0 | 0 | 0 | 3 | 30948281 | 1 | 0 | 66 | Sample1 | G | intron_variant | MODIFIER | ASXL1 | ENSG00000171456 | Transcript | ENST00000306058 | protein_coding | 1/11 | rs2208131 | 1 | SNV | HGNC | 18318 | ENSP00000305119 | A6NIZ6 | UPI00015DF8B6 | 1 | 0.4093 | 0.1672 | 0.4337 | 0.744 | 0.3499 | 0.4356 | 0.744 | EAS | 1 | |||||||||||||||||||||||||||||||||||||
| chr20_30948281 | mutect | chr20 | 30948281 | 30948281 | A | G | 11.000 | PASS | 0/1 | 3 | 1 | 0 | 3 | 0 | 0 | 0 | 3 | 30948281 | 1 | 0 | 66 | Sample1 | G | intron_variant | MODIFIER | ASXL1 | ENSG00000171456 | Transcript | ENST00000375687 | protein_coding | 1/12 | rs2208131 | 1 | SNV | HGNC | 18318 | YES | CCDS13201.1 | ENSP00000364839 | Q8IXJ9 | UPI000036702C | 1 | 0.4093 | 0.1672 | 0.4337 | 0.744 | 0.3499 | 0.4356 | 0.744 | EAS | 1 | |||||||||||||||||||||||||||||||||||
| chr20_30948281 | mutect | chr20 | 30948281 | 30948281 | A | G | 11.000 | PASS | 0/1 | 3 | 1 | 0 | 3 | 0 | 0 | 0 | 3 | 30948281 | 1 | 0 | 66 | Sample1 | G | intron_variant | MODIFIER | ASXL1 | ENSG00000171456 | Transcript | ENST00000375689 | protein_coding | 1/4 | rs2208131 | 1 | SNV | HGNC | 18318 | ENSP00000364841 | Q5JWS8 | UPI00004A2D4D | 1 | 0.4093 | 0.1672 | 0.4337 | 0.744 | 0.3499 | 0.4356 | 0.744 | EAS | 1 | |||||||||||||||||||||||||||||||||||||
| chr20_30948281 | mutect | chr20 | 30948281 | 30948281 | A | G | 11.000 | PASS | 0/1 | 3 | 1 | 0 | 3 | 0 | 0 | 0 | 3 | 30948281 | 1 | 0 | 66 | Sample1 | G | intron_variant | MODIFIER | ASXL1 | ENSG00000171456 | Transcript | ENST00000497249 | protein_coding | 1/4 | rs2208131 | 1 | cds_start_NF | SNV | HGNC | 18318 | ENSP00000451216 | UPI00021CEF59 | 1 | 0.4093 | 0.1672 | 0.4337 | 0.744 | 0.3499 | 0.4356 | 0.744 | EAS | 1 | |||||||||||||||||||||||||||||||||||||
| chr20_30948281 | mutect | chr20 | 30948281 | 30948281 | A | G | 11.000 | PASS | 0/1 | 3 | 1 | 0 | 3 | 0 | 0 | 0 | 3 | 30948281 | 1 | 0 | 66 | Sample1 | G | intron_variant | MODIFIER | ASXL1 | ENSG00000171456 | Transcript | ENST00000542461 | protein_coding | 1/5 | rs2208131 | 1 | SNV | HGNC | 18318 | ENSP00000438654 | Q6P1M8 | UPI0000232A47 | 1 | 0.4093 | 0.1672 | 0.4337 | 0.744 | 0.3499 | 0.4356 | 0.744 | EAS | 1 | |||||||||||||||||||||||||||||||||||||
| chr20_30948281 | mutect | chr20 | 30948281 | 30948281 | A | G | 11.000 | PASS | 0/1 | 3 | 1 | 0 | 3 | 0 | 0 | 0 | 3 | 30948281 | 1 | 0 | 66 | Sample1 | G | non_coding_transcript_exon_variant | MODIFIER | ASXL1 | ENSG00000171456 | Transcript | ENST00000555343 | processed_transcript | 1/7 | 462 | rs2208131 | 1 | SNV | HGNC | 18318 | 1 | 0.4093 | 0.1672 | 0.4337 | 0.744 | 0.3499 | 0.4356 | 0.744 | EAS | 1 | |||||||||||||||||||||||||||||||||||||||
| chr20_30953162 | mutect | chr20 | 30953162 | 30953162 | T | C | 15.125 | PASS | 0/1 | 4 | 1 | 0 | 4 | 0 | 0 | 4 | 0 | 30953162 | 1 | 0 | 121 | Sample1 | C | intron_variant | MODIFIER | ASXL1 | ENSG00000171456 | Transcript | ENST00000306058 | protein_coding | 1/11 | rs6141294 | 1 | SNV | HGNC | 18318 | ENSP00000305119 | A6NIZ6 | UPI00015DF8B6 | 1 | 0.4087 | 0.1672 | 0.4337 | 0.744 | 0.3499 | 0.4325 | 0.744 | EAS | 1 | |||||||||||||||||||||||||||||||||||||
| chr20_30953162 | mutect | chr20 | 30953162 | 30953162 | T | C | 15.125 | PASS | 0/1 | 4 | 1 | 0 | 4 | 0 | 0 | 4 | 0 | 30953162 | 1 | 0 | 121 | Sample1 | C | intron_variant | MODIFIER | ASXL1 | ENSG00000171456 | Transcript | ENST00000375687 | protein_coding | 1/12 | rs6141294 | 1 | SNV | HGNC | 18318 | YES | CCDS13201.1 | ENSP00000364839 | Q8IXJ9 | UPI000036702C | 1 | 0.4087 | 0.1672 | 0.4337 | 0.744 | 0.3499 | 0.4325 | 0.744 | EAS | 1 | |||||||||||||||||||||||||||||||||||
| chr20_30953162 | mutect | chr20 | 30953162 | 30953162 | T | C | 15.125 | PASS | 0/1 | 4 | 1 | 0 | 4 | 0 | 0 | 4 | 0 | 30953162 | 1 | 0 | 121 | Sample1 | C | intron_variant | MODIFIER | ASXL1 | ENSG00000171456 | Transcript | ENST00000375689 | protein_coding | 1/4 | rs6141294 | 1 | SNV | HGNC | 18318 | ENSP00000364841 | Q5JWS8 | UPI00004A2D4D | 1 | 0.4087 | 0.1672 | 0.4337 | 0.744 | 0.3499 | 0.4325 | 0.744 | EAS | 1 | |||||||||||||||||||||||||||||||||||||
| chr20_30953162 | mutect | chr20 | 30953162 | 30953162 | T | C | 15.125 | PASS | 0/1 | 4 | 1 | 0 | 4 | 0 | 0 | 4 | 0 | 30953162 | 1 | 0 | 121 | Sample1 | C | upstream_gene_variant | MODIFIER | ASXL1 | ENSG00000171456 | Transcript | ENST00000470145 | processed_transcript | rs6141294 | 1025 | 1 | SNV | HGNC | 18318 | 1 | 0.4087 | 0.1672 | 0.4337 | 0.744 | 0.3499 | 0.4325 | 0.744 | EAS | 1 |
combine_and_filter(): joint filtering and improved visualisation over time
This section is more focused on specific tasks that involve preparing the data for plotting changes over time (usually changes in the VAF). This was a recurring task within the clinical trial structures that led to the development of varikondo. This includes a not too large cohort of patients (PID) followed up over Time, usually before and after treatment, and for which some clinical information, like the percentage of tumour content, are collected over the course of the treatment. Patients usually have an overall Outcome reported, depending on whether they respond to treatment (e.g. Responders, Relapse, Refractory). A more detailed example is described in Example: variant calling in RNA-Seq.
parse_vcf_ouput() imports one VCF file at a time. The function only support VCF input files which derive from calls done on one single sample. To analyse variants over time across multiple samples (within a patient or cohort-wise), one needs to filter and combine multiple variants files to create a combined dataset to be summarise or visualised. Some variant callers like superFreq or MultiSNV (Josephidou, Lynch, and Tavaré 2015) are built with this purpose. However, these programs might not be suitable in specific scenarios, like calling complex INDELs in RNA-Seq.
combine_and_filter() helps with this. combine_and_filter() takes in input the combined data frame of variants imported with parse_vcf_output() and stacked together with functions like rbind() or bind_rows(); a patientID; a set of studyGenes if available; and some quality threshold to use for filtering. The output will be a filtered and filled data frame.
Filtered. Similarly to
import_goi_superfreq(), variants are kept of only if they pass the defined thresholds at one time point within a patient.Filled. If a variant is called at one time point but not found at others,
combine_and_filter()imputes0default values for VAF, alt_depth and ref_depth. This feature was added to allow that all patient’s time points available in theclinicalData(metadata) are represented for every variant. This allows a complete visual assessment of a variant over time. If this is not of interest to the user, variants withVAF == 0can be filtered out.
Below is an illustrative example with sample data, adapted from the type of clinical trials that we usually work on.
| SampleName | PID | Time | mutation_key | chrom | pos | alt | ref | ref_depth | VAF | mutation_det | SYMBOL | Consequence | alt_depth | variant_type |
|---|---|---|---|---|---|---|---|---|---|---|---|---|---|---|
| P1.Screen | P1 | Screen | Gene1-chr1_10-A-ACT | chr1 | 10 | ACT | A | 12 | 0.55 | Gene1-Nonsyn | Gene1 | Nonsyn | 7 | INDEL |
| P1.Screen | P1 | Screen | Gene2-chr1_20-A-ACGTCG | chr1 | 20 | ACGTCG | A | 11 | 0.40 | Gene2-Nonsyn | Gene2 | Nonsyn | 4 | INDEL |
| P1.Screen | P1 | Screen | Gene3-chr2_30-A-AGG | chr2 | 30 | AGG | A | 9 | 0.20 | Gene3-Damaging | Gene3 | Damaging | 2 | INDEL |
| P1.Cyc1 | P1 | Cyc1 | Gene1-chr1_10-A-ACT | chr1 | 10 | ACT | A | 9 | 0.48 | Gene1-Nonsyn | Gene1 | Nonsyn | 4 | INDEL |
| P1.Cyc1 | P1 | Cyc1 | Gene2-chr1_20-A-ACGTCG | chr1 | 20 | ACGTCG | A | 12 | 0.45 | Gene2-Nonsyn | Gene2 | Nonsyn | 5 | INDEL |
| P1.Cyc1 | P1 | Cyc1 | Gene3-chr2_30-A-AGG | chr2 | 30 | AGG | A | 8 | 0.25 | Gene3-Damaging | Gene3 | Damaging | 2 | INDEL |
| P1.Cyc2 | P1 | Cyc2 | Gene1-chr1_10-A-ACT | chr1 | 10 | ACT | A | 13 | 0.45 | Gene1-Nonsyn | Gene1 | Nonsyn | 6 | INDEL |
| P1.Cyc2 | P1 | Cyc2 | Gene2-chr1_20-A-ACGTCG | chr1 | 20 | ACGTCG | A | 14 | 0.50 | Gene2-Nonsyn | Gene2 | Nonsyn | 7 | INDEL |
| P2.Screen | P2 | Screen | Gene1-chr1_10-G-A | chr1 | 10 | A | G | 20 | 0.50 | Gene1-Nonsyn | Gene1 | Nonsyn | 10 | SNV |
| P2.Cyc1 | P2 | Cyc1 | Gene1-chr1_10-G-A | chr1 | 10 | A | G | 25 | 0.55 | Gene1-Nonsyn | Gene1 | Nonsyn | 14 | SNV |
| P2.Cyc2 | P2 | Cyc2 | Gene1-chr1_10-G-A | chr1 | 10 | A | G | 23 | 0.45 | Gene1-Nonsyn | Gene1 | Nonsyn | 10 | SNV |
| P2.Cyc2 | P2 | Cyc2 | Gene4-chr4_40-T-C | chr4 | 40 | C | T | 15 | 0.10 | Gene4-Damaging | Gene4 | Damaging | 2 | SNV |
| SampleName | PID | Time | Blast | Outcome |
|---|---|---|---|---|
| P1.Screen | P1 | Screen | 0.78 | Relapse |
| P1.Rem | P1 | Rem | 0.05 | Relapse |
| P1.Cyc1 | P1 | Cyc1 | 0.10 | Relapse |
| P1.Cyc2 | P1 | Cyc2 | 0.50 | Relapse |
| P2.Screen | P2 | Screen | 0.90 | Relapse |
| P2.Rem | P2 | Rem | 0.00 | Relapse |
| P2.Cyc1 | P2 | Cyc1 | 0.05 | Relapse |
| P2.Cyc2 | P2 | Cyc2 | 0.20 | Relapse |
import_clinical() was developed with the mere function to reshape clinical data, like % blast content ( = tumour content), into the same format as we store variants information to make it easier to be combined and plotted together with the VAF over time.
This can be useful to compare patient’s clinical assessment with the cancer molecular response to treatment. For example, there can be cases where even though the patient does not seem to respond to treatment (tumour content does not drop after treatment), some cancer variants do individually respond.
combine_and_fill <- varikondo::combine_and_filter(variants = sample_variants,
                               patientID = "P1",
                              # studyGenes = c("Gene1","Gene2","Gene3"),
                               clinicalData = sample_metadata,
                               min_vaf = 0.05,
                               min_alt = 2)
#> IMPACT is missing and will be filled with NAs.
#> qual is missing and will be filled with 0 and minQual = 0.

knitr::kable(combine_and_fill,caption = "Output from combine_and_filter() for patient P1 in example_variants.")| SampleName | PID | Time | chrom | pos | ref | alt | Location | mutation_det | mutation_key | SYMBOL | Consequence | variant_type | Blast | Outcome | ref_depth | VAF | alt_depth | IMPACT | qual | tot_depth | IMPACT_rank |
|---|---|---|---|---|---|---|---|---|---|---|---|---|---|---|---|---|---|---|---|---|---|
| P1.Cyc1 | P1 | Cyc1 | chr1 | 20 | A | ACGTCG | chr1_20 | Gene2 Nonsyn | chr1-20-A-ACGTCG | Gene2 | Nonsyn | INDEL | 0.10 | Relapse | 12 | 0.2941176 | 5 | NA | 0 | 17 | 1 |
| P1.Cyc2 | P1 | Cyc2 | chr1 | 10 | A | ACT | chr1_10 | Gene1 Nonsyn | chr1-10-A-ACT | Gene1 | Nonsyn | INDEL | 0.50 | Relapse | 13 | 0.3157895 | 6 | NA | 0 | 19 | 1 |
| P1.Cyc2 | P1 | Cyc2 | chr1 | 20 | A | ACGTCG | chr1_20 | Gene2 Nonsyn | chr1-20-A-ACGTCG | Gene2 | Nonsyn | INDEL | 0.50 | Relapse | 14 | 0.3333333 | 7 | NA | 0 | 21 | 1 |
| P1.Screen | P1 | Screen | chr1 | 10 | A | ACT | chr1_10 | Gene1 Nonsyn | chr1-10-A-ACT | Gene1 | Nonsyn | INDEL | 0.78 | Relapse | 12 | 0.3684211 | 7 | NA | 0 | 19 | 1 |
| P1.Screen | P1 | Screen | chr1 | 20 | A | ACGTCG | chr1_20 | Gene2 Nonsyn | chr1-20-A-ACGTCG | Gene2 | Nonsyn | INDEL | 0.78 | Relapse | 11 | 0.2666667 | 4 | NA | 0 | 15 | 1 |
| P1.Cyc1 | P1 | Cyc1 | chr1 | 10 | A | ACT | chr1_10 | Gene1 Nonsyn | chr1-10-A-ACT | Gene1 | Nonsyn | INDEL | 0.10 | Relapse | 9 | 0.3076923 | 4 | NA | 0 | 13 | 1 |
| P1.Rem | P1 | Rem | chr1 | 10 | A | ACT | chr1_10 | Gene1 Nonsyn | chr1-10-A-ACT | Gene1 | Nonsyn | INDEL | 0.05 | Relapse | 0 | 0.0000000 | 0 | NA | NA | 0 | NA |
| P1.Rem | P1 | Rem | chr1 | 20 | A | ACGTCG | chr1_20 | Gene2 Nonsyn | chr1-20-A-ACGTCG | Gene2 | Nonsyn | INDEL | 0.05 | Relapse | 0 | 0.0000000 | 0 | NA | NA | 0 | NA |
import_blast <- varikondo::import_clinical(clinicalData = sample_metadata,
                                patientID = "P1",
                                extract_column = "Blast")
knitr::kable(import_blast,caption = "Output from import_clinical() for patient P1 in example_metadata.")| SampleName | PID | Time | VAF | mutation_key | mutation_det | variant_type | SYMBOL |
|---|---|---|---|---|---|---|---|
| P1.Screen | P1 | Screen | 0.78 | Blast | Blast | Blast | Blast |
| P1.Rem | P1 | Rem | 0.05 | Blast | Blast | Blast | Blast |
| P1.Cyc1 | P1 | Cyc1 | 0.10 | Blast | Blast | Blast | Blast |
| P1.Cyc2 | P1 | Cyc2 | 0.50 | Blast | Blast | Blast | Blast |
variants <- example_variants %>%
  bind_rows(import_blast)

p1 = variants %>%
  filter(PID %in% "P1") %>%
 ggplot(aes(x = Time, y = VAF,colour = mutation_det,group = mutation_key)) +
  geom_point() +
  geom_line() +
  theme_bw() +
  theme(legend.position = "bottom") +
  ggtitle("P1 - before combine_and_filter()")


combine_and_fill <- combine_and_fill %>%
  bind_rows(import_blast)

p2 = ggplot(combine_and_fill,aes(x = Time, y = VAF,
                               colour=mutation_det,group=mutation_key)) +
  geom_point() +
  geom_line() +
  theme_bw()+
  theme(legend.position = "bottom") +
  ggtitle("P1 - after combine_and_filter()")

legend = get_legend(p1)

sec1 <- plot_grid(p1 + theme(legend.position = "none"),
          p2 + theme(legend.position = "none"))
plot_grid(sec1,
          legend,nrow=2,rel_heights = c(4,1))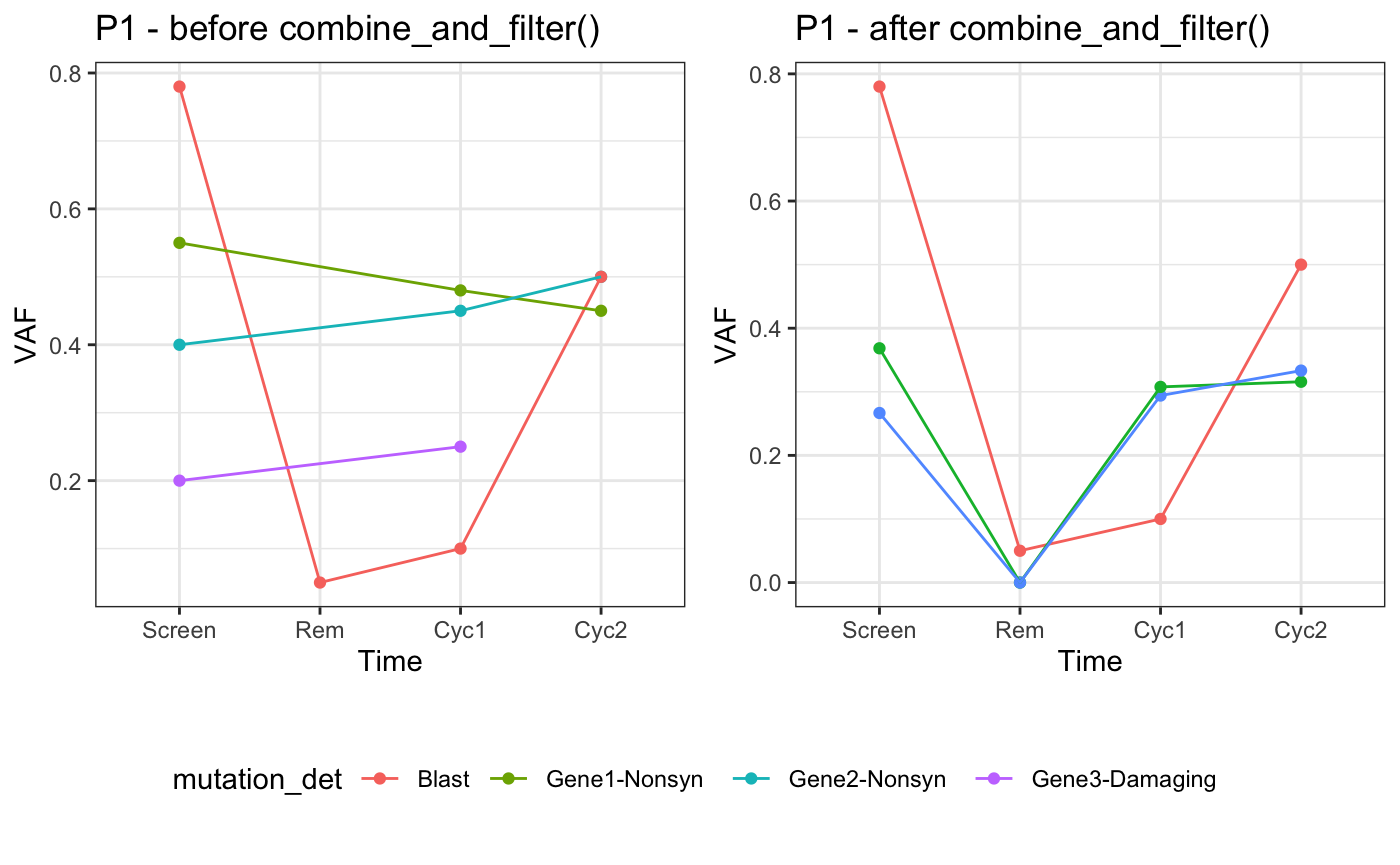
Import standardised superFreq output
import_goi_superfreq() was built to import the output produced by superFreq, normally stored in nested lists within each patient’s Rdata file or in .csv files. superFreq is used to perform clonal tracking of cancer genomes over time and therefore produces temporal output for somatic SNVs, short INDELs, CNVs and clones. A superFreq run (see instructions) will create and R folder with results stored in separate folder by patient. import_goi_supefreq(superFreq_R_path, patientID = "P1) will look into this folder to extract all the results for patient P1.
Usually, collaborators might be interested in summarising a particular subset of genes of interest which can be passed to import_goi_supefreq() as a character vector in studyGenes. If no studyGenes are provided, variants on all genes are returned. ref_genome is necessary since superFreq stores variants using a different system of genomic coordinate which needs to be converted back to cDNA locations. Other variant threshold (min_vaf and min_alt) can be used to filter variants. Within a patients, only variants which pass those thresholds at any time point will be kept.
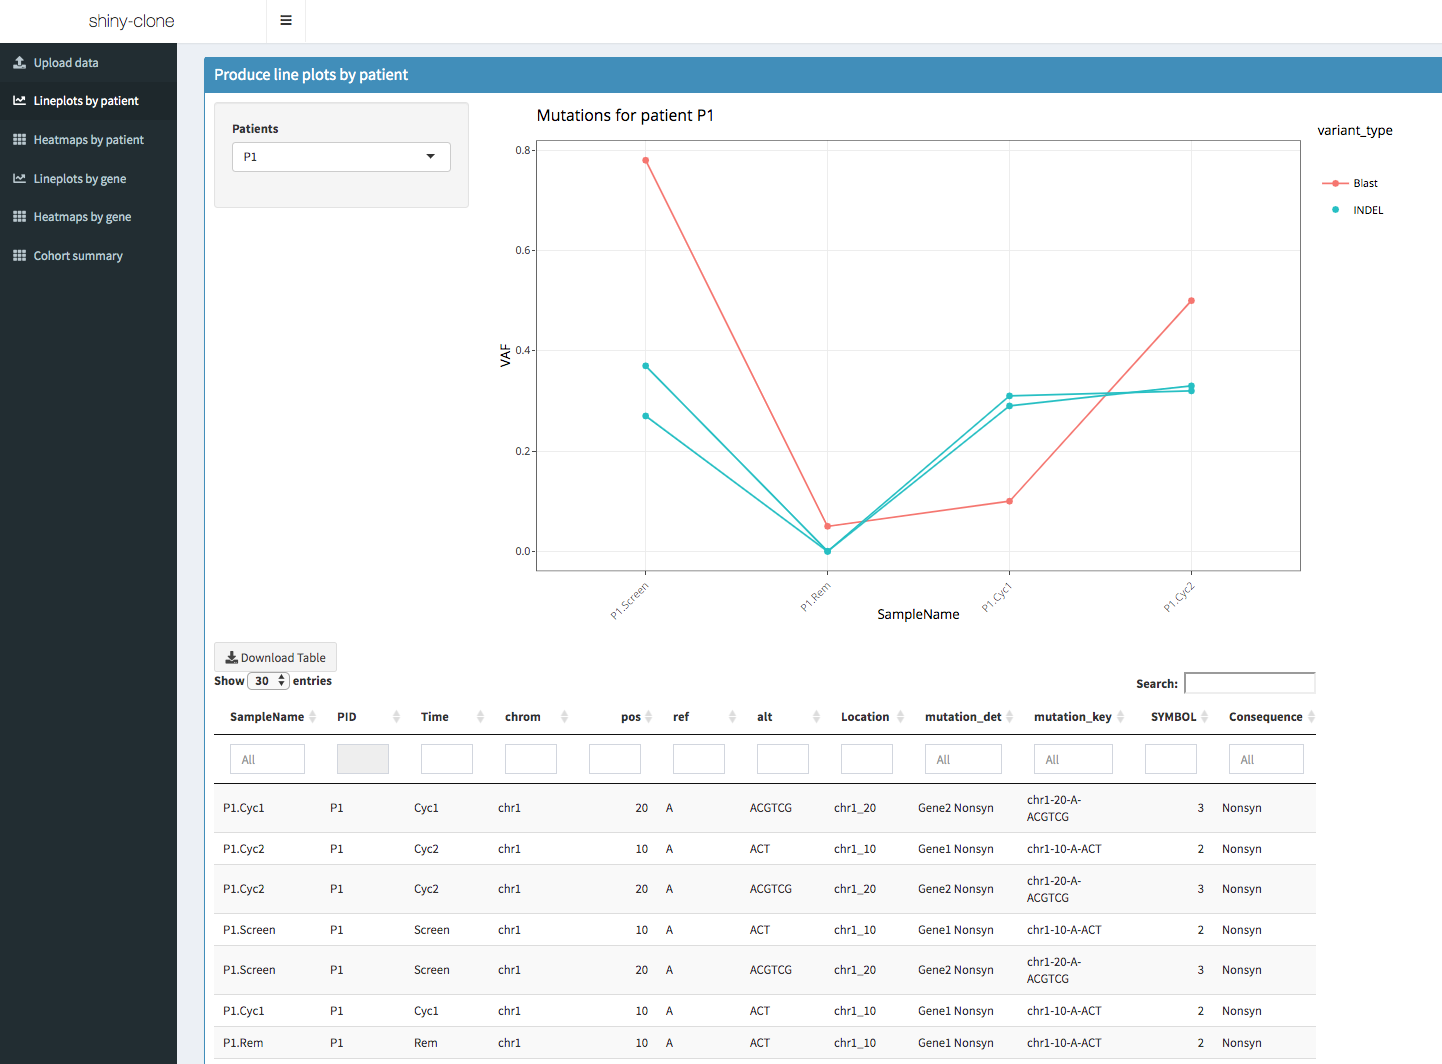
Explore variants interactively
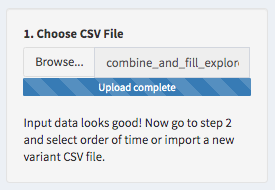
Now that variants are standardised and combined, it is possible to explore them interactively using the Shiny App https://shiny.wehi.edu.au/quaglieri.a/shiny-clone/.
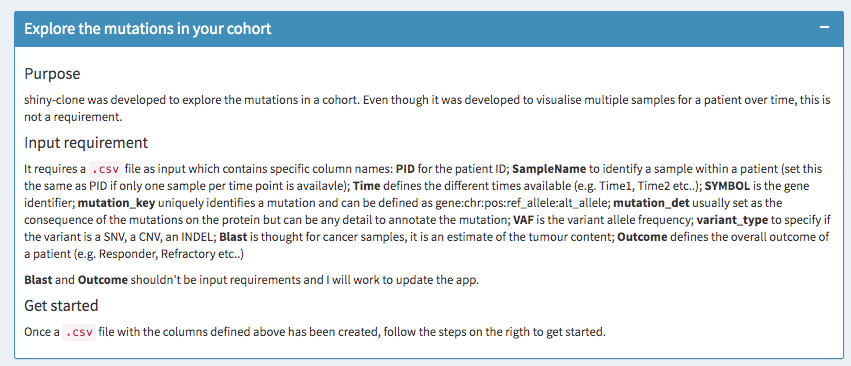
Just save the combined dataset into a .csv file and load it into https://shiny.wehi.edu.au/quaglieri.a/shiny-clone/.
Finally, before starting to explore, select the order in which the time variable should be plotted.
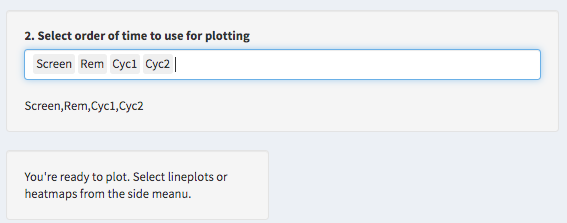
Start plotting!
Bibliography
Cibulskis, Kristian, Michael S Lawrence, Scott L Carter, Andrey Sivachenko, David Jaffe, Carrie Sougnez, Stacey Gabriel, Matthew Meyerson, Eric S Lander, and Gad Getz. 2013. “Sensitive Detection of Somatic Point Mutations in Impure and Heterogeneous Cancer Samples.” Nat. Biotechnol. 31 (3). Nature Research: 213–19.
Flensburg, Christoffer, Tobias Sargeant, Alicia Oshlack, and Ian Majewski. 2018. “SuperFreq: Integrated Mutation Detection and Clonal Tracking in Cancer.” bioRxiv.
Garrison, Erik, and Gabor Marth. 2012. “Haplotype-Based Variant Detection from Short-Read Sequencing,” July.
Josephidou, Malvina, Andy G Lynch, and Simon Tavaré. 2015. “multiSNV: A Probabilistic Approach for Improving Detection of Somatic Point Mutations from Multiple Related Tumour Samples.” Nucleic Acids Res. 43 (9): e61.
Koboldt, Daniel C, Qunyuan Zhang, David E Larson, Dong Shen, Michael D McLellan, Ling Lin, Christopher A Miller, Elaine R Mardis, Li Ding, and Richard K Wilson. 2012. “VarScan 2: Somatic Mutation and Copy Number Alteration Discovery in Cancer by Exome Sequencing.” Genome Res. 22 (3): 568–76.
Lai, Zhongwu, Aleksandra Markovets, Miika Ahdesmaki, Brad Chapman, Oliver Hofmann, Robert McEwen, Justin Johnson, Brian Dougherty, J Carl Barrett, and Jonathan R Dry. 2016. “VarDict: A Novel and Versatile Variant Caller for Next-Generation Sequencing in Cancer Research.” Nucleic Acids Res. 44 (11): e108.
McLaren, William, Laurent Gil, Sarah E Hunt, Harpreet Singh Riat, Graham R S Ritchie, Anja Thormann, Paul Flicek, and Fiona Cunningham. 2016. “The Ensembl Variant Effect Predictor.” Genome Biol. 17 (1): 122.